TimeSlider
The TimeSlider lets you assign a time attribute to a data set to view and filter the data based on dates.
Choose Time Attribute
To get the time aspect of your data to be respected on the slider, identify the desired time attribute and set it as _ol_kit_time_key on the layer.
// this is partially psuedo code (DATA_SET is made up)- don't copy/paste & expect results
import React from 'react'
import { fromLonLat } from 'ol/proj'
import olVectorSource from 'ol/source/Vector'
import olPoint from 'ol/geom/Point'
import olFeature from 'ol/Feature'
import { Map, TimeSlider, VectorLayer } from '@bayer/ol-kit'

const App = () => {
  const onMapInit = async map => {
    const features = DATA_SET.map(data => {
      // example to convert lat/lon to coords
      const coords = fromLonLat(data.latlng.reverse())
      const feature = new olFeature({ geometry: new olPoint(coords) })

      // spread all the data keys as feature properties
      // start_date will be the time key used by TimeSlider when set on layer below
      feature.setProperties({ ...data, start_date: new Date() })

      return feature
    })
    const source = new olVectorSource({ features })
    // set key so that layer.get('_ol_kit_time_key') will point to
    // the feature's time identifier
    const layer = new VectorLayer({ source, _ol_kit_time_key: 'start_date' }) // HERE'S THE MAGIC

    map.addLayer(layer)
  }

  return (
    <Map onMapInit={onMapInit}>
      <TimeSlider /> {/* be sure to set the _ol_kit_time_key on desired layers (see onMapInit) */}
    </Map>
  )
}

export default App
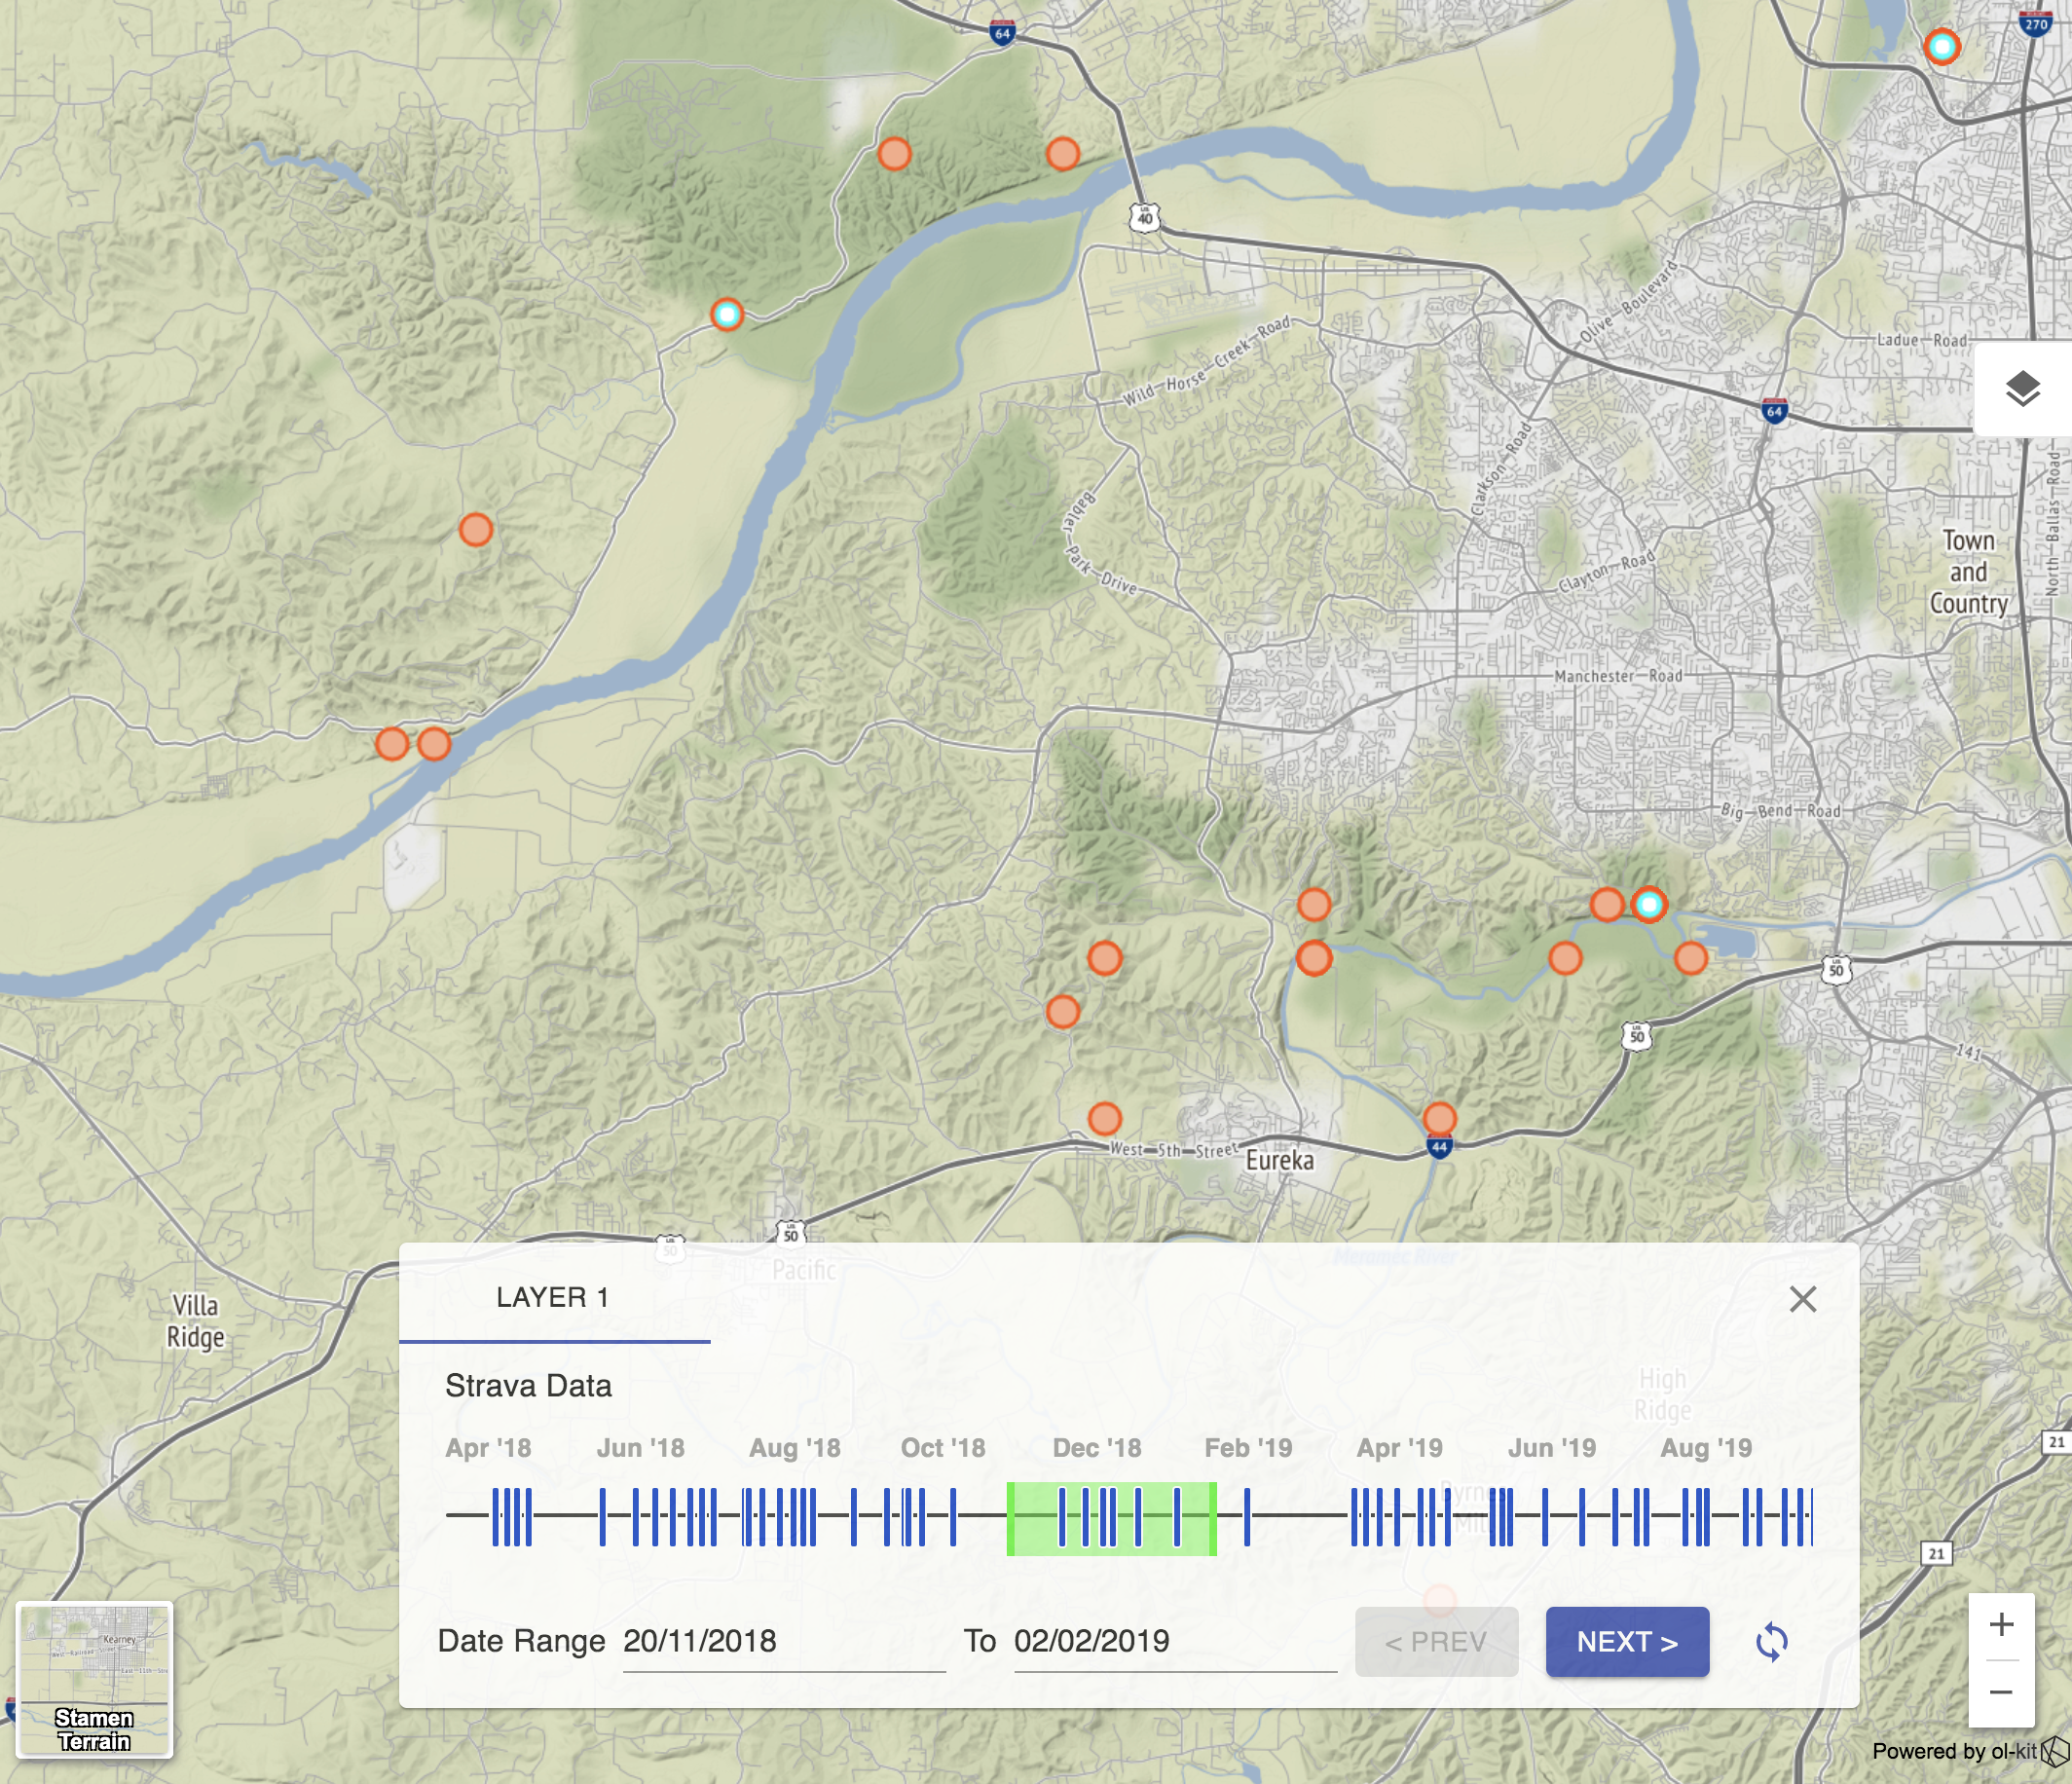
Here is an example dataset with ticks across a TimeSlider (green highlight is selection reflected by cyan points to the map):